Behavior Design
Product Strategy
Retain users using
ML & Personalization
Retain users using
ML & Personalization
Retain users using
ML & Personalization
IMPACT
+5%
Grocery Adoption
+1.3%
Returning Users
ROLE
Lead Product Designer
Lead Product Designer
TEAM
1 Product Manager
1 Product Designer
8 Engineers
2 Data Scientists
1 Product Manager
1 Product Designer
8 Engineers
2 Data Scientists
CONTEXT
Investing in long-term user retention amid competitors' pricing war
With competitors sometimes outpacing us on discounts, Talabat was looking to invest in long-term user retention instead of entering a price war.
With competitors sometimes outpacing us on discounts, Talabat was looking to invest in long-term user retention instead of entering a price war.
With competitors sometimes outpacing us on discounts, Talabat was looking to invest in long-term user retention instead of entering a price war.
COMPETITORS


OPPORTUNITY
HMW make it effortless for users to reorder groceries on Talabat?
SOLUTION
Using ML algorithm to personalize re-ordering experience
Desk Research
I APPLIED
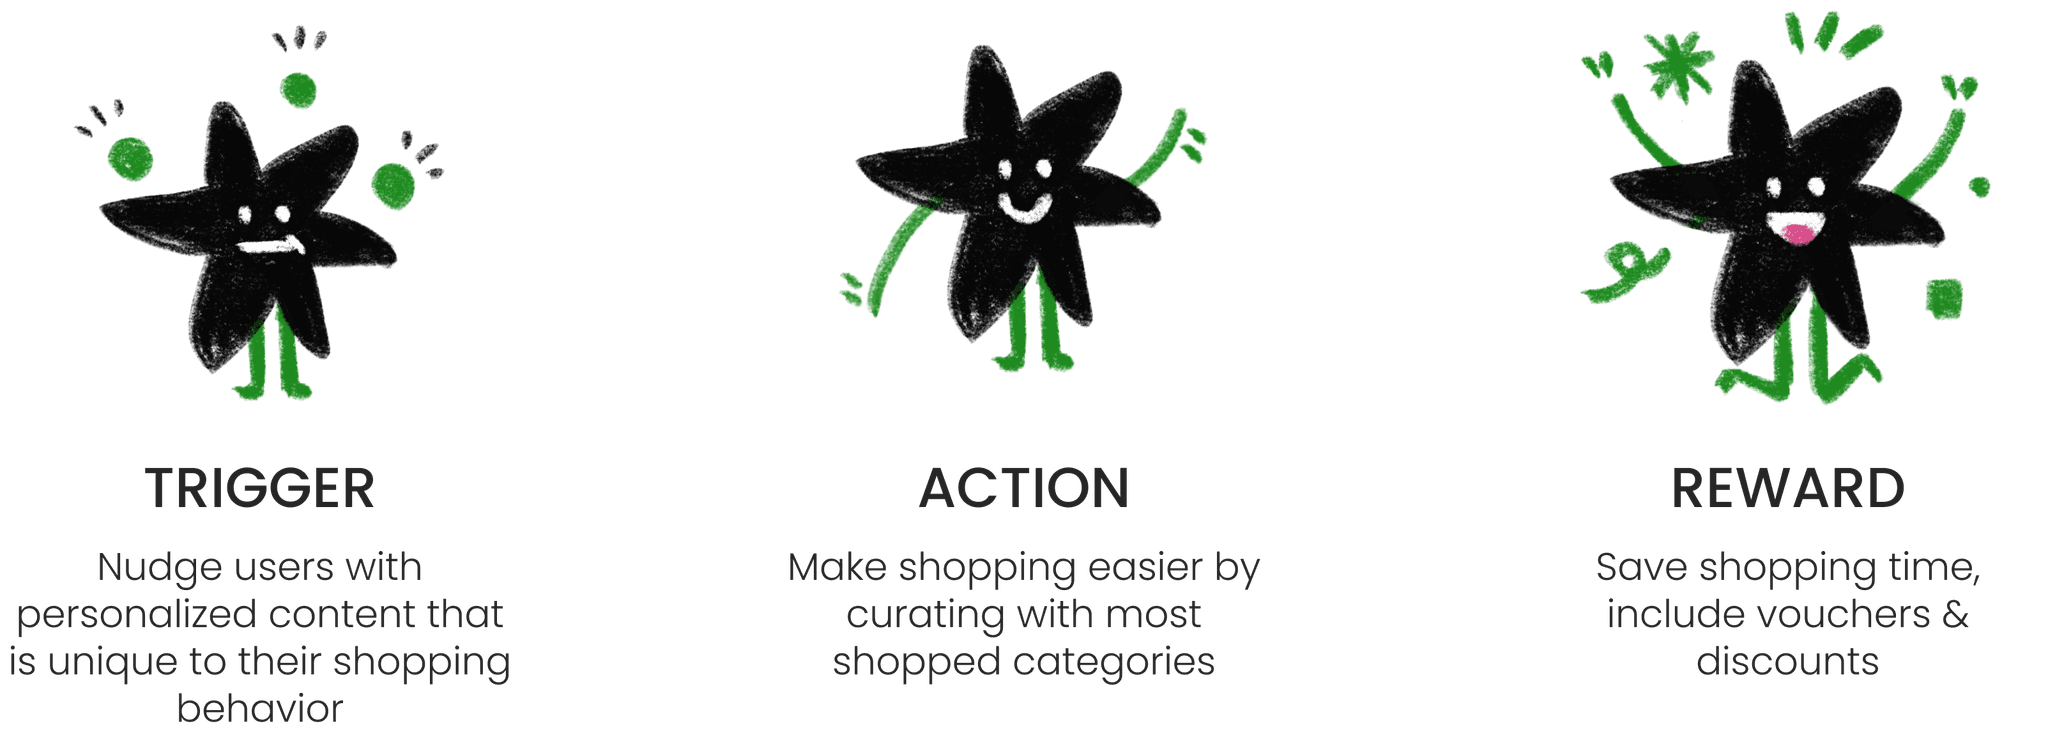
Hook's model to design a contextual and relevant user experience that retains users through value
Desk Research
I APPLIED
Hook's model to design a contextual and relevant user experience that retains users through value
Data
I USED
data from previous experiments to build conviction in the design direction that increased returning users by 1.3%
Data
I USED
data from previous experiments to build conviction in the design direction that increased returning users by 1.3%
Data
I USED
data from previous experiments to build conviction in the design direction that increased returning users by 1.3%
Cross-collaboration
I MANAGED
stakeholders across 3 cross-functional teams to design a scalable component supporting various verticals
Cross-collaboration
I MANAGED
stakeholders across 3 cross-functional teams to design a scalable component supporting various verticals
Cross-collaboration
I MANAGED
stakeholders across 3 cross-functional teams to design a scalable component supporting various verticals

BEFORE: TALABAT HOME
BEFORE: TALABAT HOME
BEFORE: TALABAT HOME

AFTER: TALABAT HOME
AFTER: TALABAT HOME
AFTER: TALABAT HOME
COMPONENT BREAKDOWN
COMPONENT BREAKDOWN

BUSINESS CHALLENGE
Navigating high-stakes decisions involving 6M+ monthly users
Navigating high-stakes decisions involving 6M+ monthly users
Navigating high-stakes decisions involving
6M+ monthly users
This project involved working closely with high-stakes decision-makers, where I quickly realized scalability was key to getting buy-in, and therefore creating multiple strategies and scenarios to advocate for the value of the solution.
This project involved working closely with high-stakes decision-makers, where I quickly realized scalability was key to getting buy-in, and therefore creating multiple strategies and scenarios to advocate for the value of the solution.
NARRATIVE: SCALABILITY

NARRATIVE: STRATEGY

HOW DID RESEARCH & DATA INFORM DESIGN?
I applied Hook’s model to design a contextual and relevant user experience
I applied Hook’s model to design a contextual and relevant user experience
I applied Hook’s model to design a contextual and relevant user experience
Recognizing that behavior is shaped by motivation and incentives, I began with user interviews to uncover their underlying goals and jobs-to-be-done.
Recognizing that behavior is shaped by motivation and incentives, I began with user interviews to uncover their underlying goals and jobs-to-be-done.
APPLYING HOOK'S MODEL TO THE SOLUTION
Conviction built through data: reordering was the key driver of habit formation
Conviction built through data: reordering was the key driver of habit formation
I built conviction through data that reordering was the key driver of habit formation
Based on the result of a successful experiment we conducted where we navigated users to the categories they usually refill, the conversion rate from the category page increased by 11.1%.
Based on the result of a successful experiment we conducted where we navigated users to the categories they usually refill, the conversion rate from the category page increased by 11.1%.
DESIGN CONSTRAINTS & TRADE-OFFS
DESIGN CONSTRAINTS
A crowded homepage with competing priorities made space a design constraint.
A crowded homepage with competing priorities made space a design constraint.
Leveraging on horizontal scroll
I designed the widget to be compact and used horizontal scrolling with clear visual affordances to maximize the available space.

Making content the main driver
I believed setting the right context through words in this widget was more important than the number of categories shown.

IMPACT
I created product strategies around adoption and retention for Grocery, Shops and Restaurants that was easily scalable on Talabat Homepage.
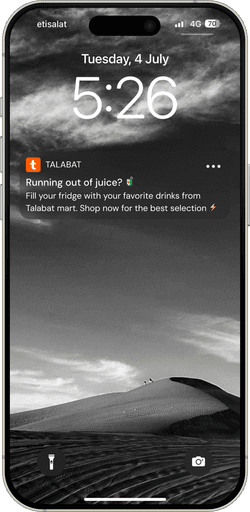
I worked with the Data Scientist to create a nudge that feels more personalized than intrusive.
+1.3%
Returning Users
DESIGN CONSTRAINTS & TRADE-OFFS
A crowded homepage with competing priorities made space a design constraint
Leveraging on horizontal scroll
I designed the widget to be compact and used horizontal scrolling with clear visual affordances to maximize the available space.
Making content the main driver
I believed setting the right context through words in this widget was more important than the number of categories shown.
DESIGN RATIONALE
A crowded homepage with competing priorities made space a design constraint
Leveraging on horizontal scroll
I designed the widget to be compact and used horizontal scrolling with clear visual affordances to maximize the available space.
Making content the main driver
I believed setting the right context through words in this widget was more important than the number of categories shown.
BUSINESS CHALLENGE
Navigating high-stakes decisions
involving 6M+ monthly users
This project involved working closely with high-stakes decision-makers, where I quickly realized scalability was key to getting buy-in, and therefore creating multiple strategies and scenarios to advocate for the value of the solution.
NARRATIVE: SCALABILITY

NARRATIVE: STRATEGY
HOW DID RESEARCH & DATA INFORM DESIGN?
I applied Hook model to design a contextual and relevant user experience
Recognizing that behavior is shaped by motivation and incentives, I began with user interviews to uncover their underlying goals and jobs-to-be-done.
APPLYING HOOK'S MODEL TO THE SOLUTION
Conviction built through data: reordering was the key driver of habit formation
Based on the result of a successful experiment we conducted where we navigated users to the categories they usually refill, the conversion rate from the category page increased by 11.1%.
IMPACT
I created product strategies around adoption and retention for Grocery, Shops and Restaurants that was easily scalable on Talabat Homepage.
I worked with the Data Scientist to create a nudge that feels more personalized than intrusive.
+5%
Grocery Adoption
+1.3%
Returning Users
OPPORTUNITY
HMW make it effortless for users to reorder groceries on Talabat?
I'M READY TO COOK!
WORKS
Copyright © 2025 Lucy Ji Soo Choi